CellPathfinder, High Content Analysis Software
The intuitive, easy-to-use interface guides the user throughout the process, including the easy graphing of image data. Yokogawa machine-learning function dramatically increasing its target recognition capability. It analyzes and digitizes complex, high degree-of-difficulty high content imaging experiment data, such as from 3D culture systems and live imaging, using several evaluation systems. The CellPathfinder software is a powerful tool for HCA.
CallPathfinder Resolves Difficulties
For screening
CellPathfinder resolves screening bottlenecks.
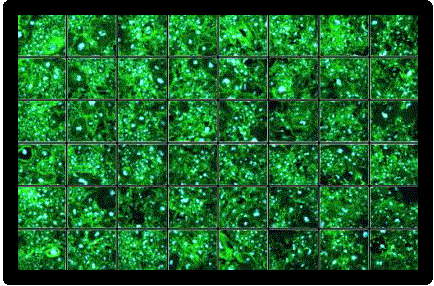
- A specialized interface for inspecting multiple samples makes image comparison easy, improving efficiency
- Advanced analysis using AI is possible through simple operation, even for beginners
- Various graph creation functions and simple image and video creation, reducing hassles at the time of reporting
For cancer research and regenerative medicine screening
CellPathfinder provides leading HCA through proprietary analysis technology.
- Label-free analysis of samples that you don’t want to stain is possible using Yokogawa’s proprietary image generation technology “CE Bright Field”
- Newly-developed easy-to-use machine-learning (standard function) makes previously difficult phenomena detection easy
- Detection of rare events (CTC, etc.) with high speed and high accuracy
Simple workflow from images to analysis and graphs
Yokogawa technology
CE Bright Field(Contrast-enhanced Bright Field )
By using Yokogawa’s “CE-Bright Field” proprietary image creation technology, two types of images can be output from bright field images. The first is an image resembling a phase-difference image, created from a regular DPC (digital phase contrast) image, and is effective for cytoplasm recognition. The second is an image resembling a fluorescence image, effective for nuclear recognition.
Abundant analysis functions
3D analysis
・Analysis of Z-stack images in three-dimensional space. ・The volume and the location of objects in 3D space can be quantified.

Label-free Analysis
The recognition of cells without the use of labeling is possible using images created with CE Bright Field technology.
Time, cost and effects on cells due to fluorescent labeling are eliminated from phenotype analysis.

Manual Region definition*1
Manual region of analysis regions is possible for complex trends that are difficult to identify through automated image processing.
Morphology in the defined regions can be visualized, facilitating analysis.

Data provided by Dr. Yasuhito Shimada, Mie University Graduate School of Medicine
*1: Coming soon


